Mining Frequent Subgraphs using the gSpan Algorithm (SPMF documentation)
This example explains how to run the GSPAN algorithm using the SPMF open-source data mining library.
How to run this example?
- If you are using the graphical interface, (1) choose the "GSPAN" algorithm, (2) select the input file "contextTKG.txt", (3) set the output file name (e.g. "output.txt") (4) set minsup to 90% and (5) click "Run algorithm".
- If you want to execute this example from the command line,
then execute this command:
java -jar spmf.jar run GSPAN contextTKG.txt output.txt 90% in a folder containing spmf.jar and the example input file contextTKG.txt. - If you are using the source code version of SPMF, launch the file "MainTestGSPAN.java" in the package ca.pfv.SPMF.tests.
What is this algorithm?
gSpan is a popular algorithm for discovering frequent subgraphs in a graph database. It was proposed by Yan et al. (2002).
What is the input of the algorithm?
The input is a set of labeled connected graphs and a threshold named minsup (a value between 0 and 100 %). Moreover, a few optional parameters can be set, which will be described further down this page.
To explain the input more clearly, some definitions are first introduced. A labeled graph is a set of vertices and edges, having some labels. Let’s me illustrate this idea with an example. Consider the following graph:
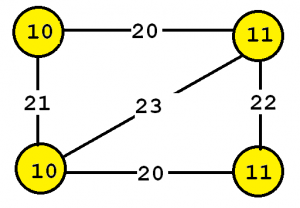
This graph contains four vertices (depicted as yellow circles). These vertices have labels such as “10” and “11”. These labels provide information about the vertices. For example, imagine that this graph is a chemical molecule. The label 10 and 11 could represent the chemical elements of Hydrogen and Oxygen, respectively. Labels do not need to be unique. In other words, the same labels may be used to describe several vertices in the same graph. For example, if the above graph represents a chemical molecule, the labels “10” and “11” could be used for all vertices representing Oxygen and Hydrogen, respectively.
Now, besides vertices, a graph also contains edges. The edges are the lines between the vertices, here represented by thick black lines. Edges also have some labels. In this example, four labels are used, which are 20, 21, 22 and 23. These labels represents different types of relationships between vertices. Edge labels do not need to be unique. A graph is a connected graph if by following the edges, it is possible to go from any vertex to any other vertices.
The goal of frequent subgraph mining is to discover interesting subgraph(s) appearing in a set of graphs (a graph database). But how can we judge if a subgraph is interesting? This depends on the application. The interestingness can be defined in various ways. Traditionally, a subgraph has been considered as interesting if it appears multiple times in a set of graphs. In other words, we want to discover subgraphs that are common to multiple graphs. This can be useful for example to find association between chemical elements common to several chemical molecules.
The algorithm takes a graph database as input. Then, the frequent subgraph mining algorithm will enumerate as output all frequent subgraphs. A frequent subgraph is a subgraph that appears in at least minsup percents of the graphs from the graph database. For example, let’s consider the following graph database containing three graphs, which is provided in the file contextTKG.txt of the SPMF distribution.
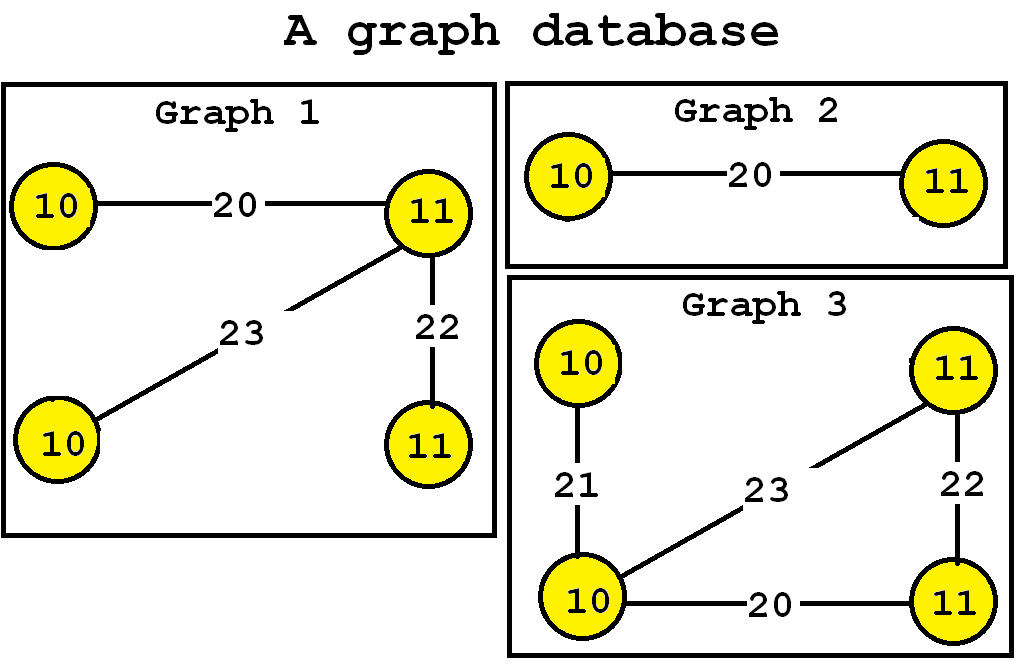
This database contains three graphs, respectively called Graph 1, 2 and 3.
What is the output of the algorithm?
The output is the set of all subgraphs that appear in at least minsup percent of the graphs of the input graph database, and their support values. In this example, consider that the minsup parameter is set to 90 % (which means that frequent subgraphs must appear in at least 3 graphs of the input database since 90 % * 3 = 3). By applying the gSpan algorithm, we obtain the set of all subgraphs appearing in at least three graphs:
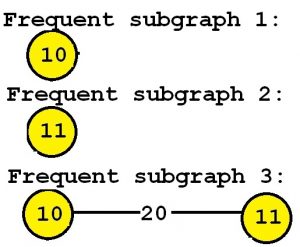
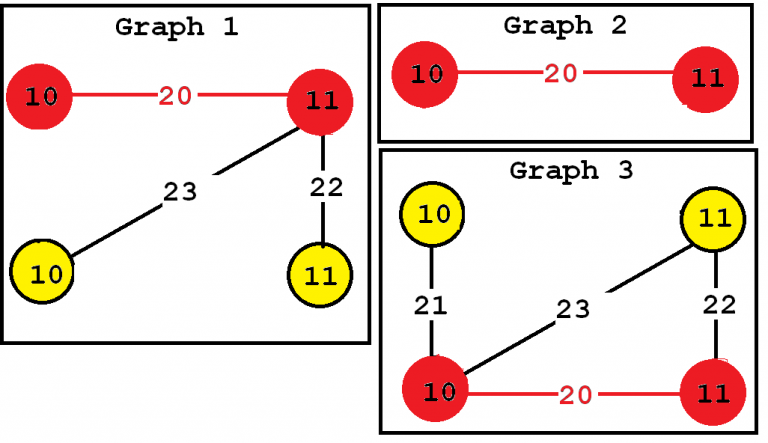
Consider the third subgraph (“Frequent subgraph 3”). This subgraph is frequent and is said to have a support (a frequency) of 3 since it appears in three of the input graphs. These occurrences are highlighted in red, below:
In this example "Frequent subgraph 1" and "Frequent subgraph 2" also have a support of 3. Note that the support of a graph can be also expressed as a percentage. Since these subgraphs appear in three input graphs and the input database contains three graphs, the support of these subgraphs expressed as a percentage is 3 / 3 = 1 (which means 100 %).
Optional parameters
This implementation of gSpan also has four optional parameters:
- maxNumberOfEdges : the maximum number of edges that frequent subgraphs should contain. This can be used to reduce the search space and find less frequent subgraphs.
- outputSingleFrequentVertices: if this parameter is set to true (by default), then frequent subgraphs containing a single vertex will also be output. Otherwise, not.
- outputDotFile: if this parameter is set to true (by default : false), then a DOT file will be also created as output. A DOT is a GraphViz file that can be used to visualize the frequent subgraphs using GraphViz
- outputGraphIds: if this parameter is set to true (by default: false), then the output file will indicate for each frequent subgraph, the list of input graphs where the subgraph appears.
The optional parameter can be specified in the graphical user interface of SPMF, but also when running SPMF from the command line. For example, to call gSpan from the command line with minsup = 0.9, maxNumberOfEdges = 2, outputSingleFrequentVertices = true, outputDotFile = false and outputGraphIds = true, the command can be written as follows:
java -jar spmf.jar run GSPAN contextTKG.txt output.txt 0.9 2 true false true
Input file format
The input file format is defined as follows. It is a text file which contains one or more graphs. A graph is defined by a few lines of text that follow the following format:
- t # N This is the first line of a graph. It indicates that this is the N-th graph in the file
- v M L This line defines the M-th vertex of the current graph, which has a label L
- e P Q L This line defines an edge, which connects the P-th vertex with the Q-th vertex. This edge has the label L
For the above example, the input file is defined as follows:
t # 0
v 0 10
v 1 11
v 2 10
v 3 11
e 0 1 20
e 1 2 23
e 1 3 22
t # 1
v 4 10
v 5 11
e 4 5 20
t # 2
v 6 10
v 7 10
v 8 11
v 9 11
e 6 7 21
e 7 8 23
e 7 9 20
e 8 9 22
Output file format
The output file format is defined as follows. It is a text file, listing all the frequent subgraphs found in the input graph database. A frequent subgraph is defined by a few lines of text that follow the following format:
- t # N * Z This is the first line of a subgraph. It indicates that this is the N-th subgraph in the file and that its support is Z.
- v M L This line defines the M-th vertex of the current subgraph, which has a label L
- e P Q L This line defines an edge, which connects the P-th vertex with the Q-th vertex. This edge has the label L
- x X1 X2 ... This lines lists the identifiers of all the graphs X1, X2 ... that contains the current subgraph.
t # 0 * 3
v 0 10
x 0 1 2
t # 1 * 3
v 0 11
x 0 1 2
t # 2 * 3
v 0 10
v 1 11
e 0 1 20
x 0 1 2
Performance
The gSpan algorithm is an important algorithm that is efficient and has inspired several other algorithms. This implementation is optimized and includes a few optimizations to increase efficiency.
Where can I get more information about the algorithm?
This is the article describing the algorithm:
X. Yan and J. Han. (2002). gSpan: Graph-Based Substructure Pattern Mining,. Proc. 2002 of Int. Conf. on Data Mining (ICDM'02), IEEE.